
How to Study Epidemiology for Public Health Exams
Study epidemiology for public health exams: master study design and bias, drill incidence, prevalence, RR and OR, and answer interpretation questions.
Table of Contents
- What Epidemiology Exams Actually Test
- Study Design and Bias: The Conceptual Core
- The study design ladder
- Bias: the three families
- How to make study design stick
- Calculation Practice: Incidence, Prevalence, and Measures of Association
- A worked example
- Screening test math
- How to drill calculations so they hold under pressure
- How to Answer Epidemiology Questions That Test Interpretation
- The interpretation cheat sheet
- The four-step method for interpretation questions
- Common traps
- A 6-Week Epidemiology Study Plan
- Turn Your Epidemiology Notes Into Flashcards Automatically
- Frequently Asked Questions
- What is the hardest part of epidemiology exams?
- Should I memorize formulas or understand them?
- When do I use relative risk vs. odds ratio?
- How long does it take to study epidemiology for the CPH?
- What's the difference between confounding and effect modification?
- The Bottom Line
To study epidemiology for a public health exam, start with study design and bias, because most questions test whether you can recognize a design and the bias that threatens it. Then drill the core calculations (incidence, prevalence, relative risk, odds ratio, attributable risk, sensitivity and specificity) from a 2x2 table until they’re automatic, and practice interpretation questions that ask what a result means, not just what it equals. Most students need 4 to 8 weeks of steady practice, about 30 to 60 minutes a day.
Here’s the thing nobody tells you about epidemiology exams. The formulas are the easy part. You can learn every one of them in a weekend. What sinks people is the question that says, “A researcher finds an odds ratio of 0.6 with a 95% confidence interval of 0.3 to 1.2. Which conclusion is correct?” Suddenly the formula you memorized isn’t enough. You need to think like an epidemiologist.
That’s what this guide is about. Whether you’re preparing for the CPH exam, an MPH comprehensive exam, a graduate epidemiology course final, or the biostatistics and epidemiology section of USMLE or nursing boards, the strategy is the same. (It’s a subject-specific version of our general guide on studying for exams.)
What Epidemiology Exams Actually Test
Epidemiology exams test three skills: identifying study designs, spotting bias and confounding, and calculating and interpreting measures of disease frequency and association. Pure definitions make up a smaller share than most students expect.
Here’s a rough breakdown of what I see across public health exams and course finals:
| Skill | Typical share of questions | Example question |
|---|---|---|
| Study design recognition | 20 to 25% | “Which design is described in this abstract?” |
| Bias, confounding, validity | 20 to 25% | “Which bias best explains this result?” |
| Calculations from a 2x2 table | 20 to 30% | “Calculate the relative risk of disease.” |
| Interpretation of results | 20 to 25% | “What does a confidence interval crossing 1 mean?” |
| Screening and diagnostic tests | 10 to 15% | “What happens to PPV if prevalence falls?” |
| Outbreak investigation, surveillance | 5 to 10% | “What is the next step after confirming the outbreak?” |
These are approximate weights from my experience with exam blueprints and past papers, not an official breakdown. For the CPH, check the current content outline from the National Board of Public Health Examiners (NBPHE), since epidemiology concepts appear across several of its domains rather than in one tidy section.
The key insight: at least half the exam is conceptual. If you only drill formulas, you’re preparing for half the test.
Study Design and Bias: The Conceptual Core
Learn study designs by asking one question: how were participants selected, by exposure or by outcome, and when was each measured? That single question separates cohort studies, case-control studies, cross-sectional studies, and trials almost every time.
The study design ladder
Think of designs as a ladder of evidence strength, from weakest to strongest for causal claims:
| Design | How participants are selected | Measure of association | Main weakness |
|---|---|---|---|
| Case report / case series | Patients with the disease, no comparison group | None | No control group |
| Ecological study | Groups or populations, not individuals | Correlation | Ecological fallacy |
| Cross-sectional | A sample at one point in time | Prevalence ratio, prevalence OR | Can’t establish which came first |
| Case-control | By outcome (cases vs. controls) | Odds ratio | Recall bias, selection of controls |
| Cohort (prospective or retrospective) | By exposure | Relative risk, incidence | Loss to follow-up, expensive, slow |
| Randomized controlled trial | Randomly assigned exposure | RR, risk difference, NNT | Cost, ethics, generalizability |
| Systematic review / meta-analysis | Pooled studies | Pooled estimate | Publication bias, heterogeneity |
Two shortcuts save a lot of points:
- Rare disease? Think case-control. You can’t wait for 10,000 people to maybe develop a rare cancer, so you start with the cases.
- Rare exposure? Think cohort. You recruit the few people with the exposure (say, workers in one factory) and follow them.
Bias: the three families
Every bias question comes down to one of three families: selection bias, information bias, or confounding. Learn the family first, then the specific named bias.
- Selection bias: the way people got into (or stayed in) the study distorts the result. Examples: healthy worker effect, loss to follow-up, Berkson’s bias, volunteer bias.
- Information bias: exposure or outcome is measured wrongly. Examples: recall bias (cases remember exposures better than controls), interviewer bias, misclassification (differential or non-differential).
- Confounding: a third variable is linked to both the exposure and the outcome and isn’t on the causal path. Classic example: coffee drinking and lung cancer, confounded by smoking.
Then there are the screening biases that show up on almost every public health exam:
| Bias | What happens | Why it fools you |
|---|---|---|
| Lead-time bias | Screening finds disease earlier, but death happens at the same time | Survival looks longer from diagnosis |
| Length-time bias | Screening catches slow-growing disease more often | Screened cases look less aggressive |
| Overdiagnosis | Screening finds disease that would never cause harm | Inflates survival and cure rates |
How to make study design stick
Reading a chapter on study designs gives you a warm feeling of familiarity. Then the exam describes a design in four sentences of dense abstract language and you freeze.
The fix is active recall with real descriptions. Take abstracts from real papers (PubMed is free) and hide the methods label. Read the description and name the design before checking. Do 5 a day for two weeks and you’ll recognize designs in seconds. Our guide to active recall techniques explains why this works so much better than rereading.
Also make “what bias threatens this?” cards. For each design, write the card: “Case-control study of diet and colon cancer, using questionnaires. Main threat?” Answer: recall bias.
Calculation Practice: Incidence, Prevalence, and Measures of Association
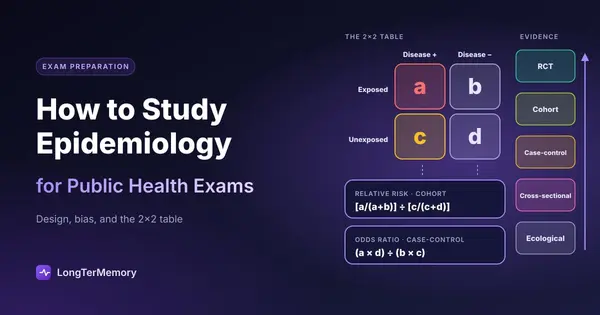
Nearly every epidemiology calculation comes from one 2x2 table, so learn to draw it from memory first and every formula follows from it. Put exposure on the rows, disease on the columns, and label the cells a, b, c, d.
| Disease + | Disease − | Total | |
|---|---|---|---|
| Exposed | a | b | a + b |
| Unexposed | c | d | c + d |
From this table, here are the formulas you need:
| Measure | Formula | Used in |
|---|---|---|
| Risk in exposed | a / (a + b) | Cohort, RCT |
| Risk in unexposed | c / (c + d) | Cohort, RCT |
| Relative risk (RR) | [a / (a + b)] / [c / (c + d)] | Cohort, RCT |
| Odds ratio (OR) | (a × d) / (b × c) | Case-control |
| Attributable risk (risk difference) | Risk exposed minus risk unexposed | Cohort, RCT |
| Attributable risk percent | (RR − 1) / RR × 100 | Cohort |
| Number needed to treat (NNT) | 1 / absolute risk reduction | RCT |
And for disease frequency:
- Incidence = new cases during a period / population at risk during that period
- Incidence rate = new cases / person-time at risk
- Point prevalence = all existing cases at one time / total population
- Prevalence ≈ incidence × average duration (for a stable, low-prevalence disease)
That last relationship explains a classic exam question: a new treatment keeps patients alive longer without curing them. What happens to prevalence? It goes up, because duration increases.
A worked example
A cohort of 1,000 smokers and 1,000 non-smokers is followed for 10 years. 30 smokers and 10 non-smokers develop the disease.
- Risk in smokers = 30 / 1,000 = 3%
- Risk in non-smokers = 10 / 1,000 = 1%
- RR = 3.0: smokers have three times the risk
- Risk difference = 2 percentage points: 20 extra cases per 1,000 smokers over 10 years
Notice that the RR and the risk difference tell different stories. An RR of 3 sounds dramatic. A difference of 2 percentage points sounds modest. Exams love asking which one matters for public health planning (the absolute difference usually does).
Screening test math
Screening uses a slightly different table: test result on the rows, true disease status on the columns.
- Sensitivity = true positives / all with disease = a / (a + c)
- Specificity = true negatives / all without disease = d / (b + d)
- PPV = true positives / all who tested positive = a / (a + b)
- NPV = true negatives / all who tested negative = d / (c + d)
The concept that shows up most: sensitivity and specificity are properties of the test, but PPV and NPV depend on prevalence. When prevalence drops, PPV drops too, even with the same test. Memory hooks that work well: SnNout (a highly Sensitive test, when Negative, rules out) and SpPin (a highly Specific test, when Positive, rules in).
How to drill calculations so they hold under pressure
Calculations decay fast if you learn them once and move on, so spread practice across weeks with short daily sets. A 2006 meta-analysis by Cepeda and colleagues, pooling hundreds of experiments, found that spaced practice consistently beats massed practice for long-term retention. For epidemiology, that means 5 calculation problems a day for a month instead of 100 problems the weekend before.
A daily routine that works:
- Draw a blank 2x2 table from memory (30 seconds).
- Solve 3 to 5 problems that mix RR, OR, sensitivity, PPV, and NNT.
- For each, write one sentence interpreting the result in plain English.
- Any problem you got wrong becomes a flashcard for tomorrow.
Mixing problem types matters. If you do 20 RR problems in a row, you never practice the real skill, which is deciding which measure the question needs. That’s interleaving, and you can read more about it in our post on interleaved practice. If numbers in general slip away from you, our guide to memorizing numbers and statistics has a few extra tricks.
How to Answer Epidemiology Questions That Test Interpretation
Interpretation questions are answered by translating the number into a plain sentence before looking at the options. If you can’t say what an RR of 0.7 means in words, the options will all look plausible.
The interpretation cheat sheet
| Result | Plain English meaning |
|---|---|
| RR or OR = 1 | No association |
| RR or OR > 1 | Exposure associated with higher risk or odds |
| RR or OR < 1 | Exposure associated with lower risk (possibly protective) |
| 95% CI includes 1 (for RR or OR) | Not statistically significant at the 5% level |
| 95% CI includes 0 (for a risk difference) | Not statistically significant at the 5% level |
| p < 0.05 | Result unlikely if there were truly no association (not “95% chance it’s true”) |
| Wide confidence interval | Imprecise estimate, often small sample |
The four-step method for interpretation questions
- Name the design. Cohort? Case-control? This tells you which measure is valid.
- Translate the result. “People exposed had 40% lower odds of the outcome.”
- Check significance and precision. Does the CI cross the null value?
- Ask what else could explain it. Chance, bias, confounding, or reverse causation.
Step 4 is where public health exams separate good students from great ones. A statistically significant association is not a causal one. The Bradford Hill criteria (strength, consistency, specificity, temporality, biological gradient, plausibility, coherence, experiment, and analogy), proposed by Austin Bradford Hill in 1965, give you a framework for judging causation. Of these, temporality is the only one that’s truly required: the exposure must come before the outcome.
Common traps
- Using RR in a case-control study. You can’t calculate true risk when you selected people by outcome. Use the OR.
- Confusing p-values with probability of truth. A p of 0.03 doesn’t mean there’s a 97% chance the hypothesis is right.
- Ignoring absolute numbers. A 50% relative reduction from 2 in 10,000 to 1 in 10,000 is tiny in absolute terms.
- Forgetting effect modification. If the association differs by subgroup (say, strong in women, absent in men), that’s not confounding, it’s effect modification, and you report results separately.
A 6-Week Epidemiology Study Plan
Six weeks of 30 to 60 minutes a day is enough for most public health exams if you combine concept review, daily calculations, and spaced flashcard review.
| Week | Focus | Daily practice |
|---|---|---|
| 1 | Measures of frequency, 2x2 table, RR and OR | 5 calculation problems |
| 2 | Study designs, ladder of evidence | 5 abstracts: name the design |
| 3 | Bias, confounding, effect modification | 5 “which bias?” questions |
| 4 | Screening, sensitivity, PPV, screening biases | Mixed calculations |
| 5 | Causation, outbreak investigation, surveillance | Full mixed question sets |
| 6 | Timed practice exams, review weak areas | Flashcards + 1 timed set |
Throughout all six weeks, spend 10 to 15 minutes a day on flashcard review. This keeps week 1’s formulas alive in week 6, which is the whole point. If you’re preparing for the full CPH, our CPH exam study guide covers the other domains.
Good sources to study from:
- CDC’s “Principles of Epidemiology in Public Health Practice” (free self-study course, very exam-friendly)
- Gordis’ Epidemiology, the classic textbook for MPH programs
- Your course lecture slides and past exams (the best predictor of your actual exam)
- NBPHE practice materials if you’re taking the CPH
Turn Your Epidemiology Notes Into Flashcards Automatically
Building cards for every design, bias, and formula by hand takes hours, and most students give up halfway through. A faster route: upload your lecture slides, the CDC self-study PDF, or your textbook chapters to LongTerMemory. It generates question and answer pairs from your own material and schedules them with spaced repetition, so lead-time bias and PPV come back right before you’d forget them. The free trial is enough to build a deck for a full course and test it for a couple of weeks, which leaves your study time for what really matters: calculation practice and interpretation questions.
Frequently Asked Questions
What is the hardest part of epidemiology exams?
For most students it’s interpretation and bias questions, not calculations. Formulas are learnable in days, but recognizing the right bias in a complex scenario takes weeks of practice.
Should I memorize formulas or understand them?
Both, but understanding comes first. If you can draw the 2x2 table and know what each cell means, you can rebuild most formulas on the spot.
When do I use relative risk vs. odds ratio?
Use relative risk for cohort studies and trials, where you follow people by exposure. Use odds ratio for case-control studies, where you select people by outcome. When disease is rare, the OR approximates the RR.
How long does it take to study epidemiology for the CPH?
Most candidates spend 4 to 8 weeks on epidemiology and biostatistics concepts as part of a broader 2 to 3 month CPH plan.
What’s the difference between confounding and effect modification?
Confounding is a distortion you want to remove (by adjusting or stratifying). Effect modification is a real difference in the association across subgroups that you want to report.
The Bottom Line
Epidemiology exams reward students who can recognize designs, name biases, calculate from a 2x2 table, and translate results into plain English. Spend half your time on concepts and half on calculations, practice a little every day, and interpret every number you calculate.
Start today: draw a blank 2x2 table from memory, label it, and write the formulas for RR and OR underneath. If you can do it in under a minute, you’ve already built the foundation for most of the exam.